Natural regeneration is key for large-scale forest restoration, yet it may lead to different biodiversity outcomes depending on the socio-environmental context.
We combined the results of a global meta-analysis to quantify how biodiversity recovery in naturally regenerating forests deviates from biodiversity values in reference to old-growth forests, with structural equation modeling, to identify direct and indirect associations between socioeconomic, biophysical, and ecological factors and deviation in biodiversity recovery at a landscape scale. Low deviation within a landscape means higher chances of multiple sites in naturally regenerating forests successfully recovering biodiversity compared to reference forests.
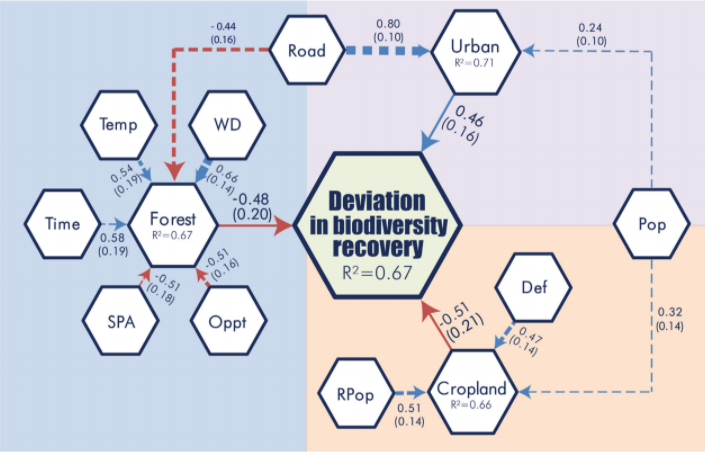
Deviation in biodiversity recovery was directly negatively associated with the percentage of cropland, forest cover, and positively associated with the percentage of urban areas in the surrounding landscape. These three factors mediated the indirect associations with rural population size, recent gross deforestation, time since natural regeneration started, mean annual temperature, mean annual water deficit, road density, land opportunity cost, percentage cover of strictly protected forest areas, and human population variation in the surrounding landscape.
We suggest that natural forest restoration should be prioritized in landscapes with both low socioeconomic pressures on land-use conversion to pasturelands and urban areas and a high percentage of forest cover.

Direct and indirect associations between socio-environmental factors and deviation in biodiversity recovery. Colored panels indicate different pathways (blue–percentage of forest cover (Forest); purple–percentage of urban areas (Urban); pink–percentage of cropland (Cropland), with solid (direct paths) and dotted lines (indirect paths). Blue lines represent positive associations and red lines, negative associations. Def = gross deforestation rate, Rpop = rural population density, Pop = human population variation, Oppt = land opportunity cost, Road = road density, Time = time since natural regeneration started, WD = water deficit, Temp = mean annual temperature, SPA = strictly protected forest areas. Estimates and standard deviation (in parentheses) are given for each path. R2 values showed independent variables symbols represent the fraction of deviation in biodiversity recovery explained by four multiple generalized linear regressions included in the Structural Equation Model
< Previous Next >
Back to Publications


